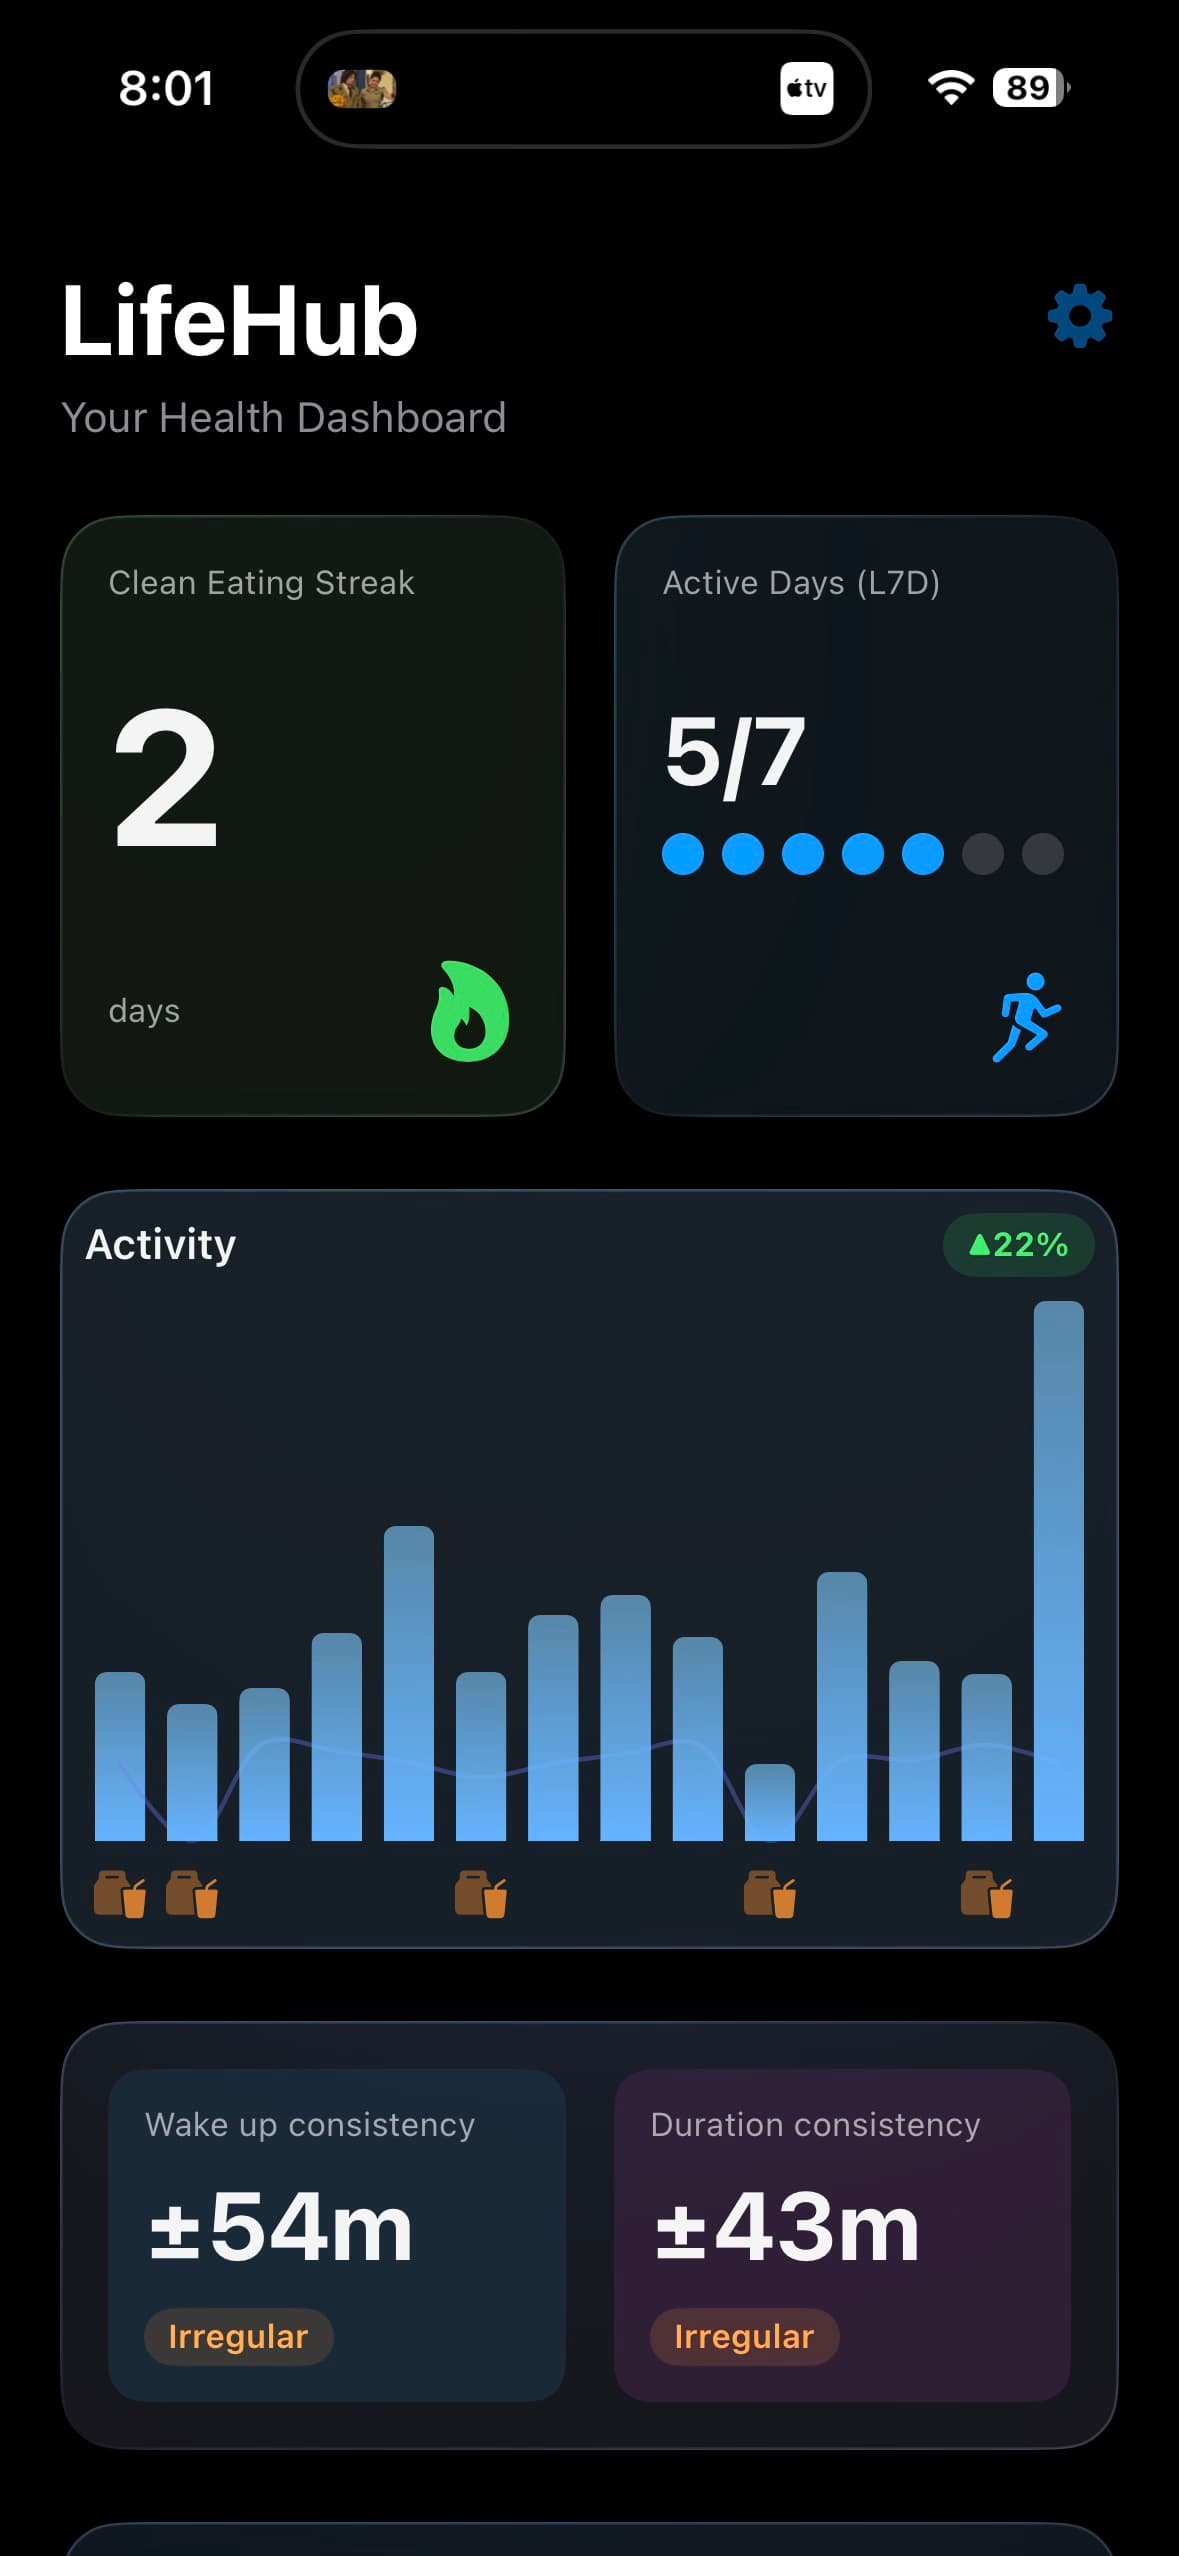
In an era of relentless push notifications and glowing screens, accessing personal health data often means unlocking a phone and diving into a rabbit hole of apps. LifeHub is a personal analytics ecosystem designed to solve this by bridging the digital and physical worlds — an iOS app that aggregates HealthKit and lifestyle data, a Home/Lock Screen widget for glanceable status, and an always-on E-Ink display in the home, all running on a "calm technology" philosophy: there when you need it, updated on your terms, never demanding attention.
The Architecture: A Tale of Two Systems
The repo is split into two real components, LifeHub_app/ and LifeHub_dash/, bridged by a thin cloud layer:
1. LifeHub_app (iOS + WidgetKit): A SwiftUI application and its WidgetKit extension. The app is the central data aggregator; the widget is a read-only glance surface sharing the app's SwiftData store via an App Group.
2. The Bridge (GitHub Gist): A private JSON file serves as the dead drop between phone and Pi.
3. LifeHub_dash (Raspberry Pi & E-Ink): A hardware-optimized Python application that wakes on a schedule, fetches the Gist JSON, renders the dashboard, and sleeps.
Part 1: LifeHub_app (iOS)
The main app target now renders a dark frosted-glass "Consistency Bento" dashboard — a redesign away from an earlier lighter layout — built around a 30-day hero timeline plus compact cards for nutrition, workouts, movement, sleep, weight, and DoorDash spend. The emphasis is on rhythm and streak protection rather than treating any single number (like weight) as the headline score.
Data Sources & Logic
- HealthKit: steps, active energy, sleep, weight, dietary calories/macros, and workout sessions. Weight uses forward-filling logic so daily weigh-ins aren't required; the app computes streaks and consistency ratios (e.g. "Active Day Ratios" for days over 8,000 steps) across all of these.
- Food delivery spending (Google Sheets CSV): tracks a "Clean Streak" — days since the last takeout order.
- DoorDash-vs-VOO counterfactual:
StockPriceFetcherpulls VOO daily closes from Stooq's free CSV endpoint (no API key) and shows what the same delivery spend would be worth today if it had been invested in the S&P 500 instead.
Home Screen & Lock Screen Widget
LifeHubWidgetExtension renders 7-day Move/Eat/Sleep habit sparklines (.systemSmall, .systemMedium) and a lock-screen habits-hit gauge (.accessoryCircular, .accessoryInline). The widget never touches HealthKit, the network, or refresh logic directly — it only reads a small cached WidgetSummary JSON blob that the main app writes after each refresh, keeping the widget process lightweight and battery-safe.
The "Manual Refresh" Philosophy
Unlike apps that drain battery in the background, LifeHub relies on intentional refreshes:
- Incremental Refresh: updates the last 7 days of data.
- Comprehensive Refresh: rebuilds full history.
Either refresh compiles a dashboard_data.json payload — calculated summaries plus raw chart data — and uploads it to a GitHub Gist via a Personal Access Token stored in the iOS Keychain.
Part 2: LifeHub_dash (Raspberry Pi)
A Raspberry Pi Zero 2 W with a Waveshare 7.5" E-Ink display and a PiSugar 3 battery HAT, currently deployed and running Raspberry Pi OS Lite (Debian 13 "Trixie"), waking daily at 7:00 AM local time via the PiSugar RTC.
The "Fat Python, Skinny HTML" Approach
Rendering complex layouts on E-Ink is notoriously hard with standard drawing libraries, so LifeHub uses the web stack instead: a local Flask server renders a Tailwind-styled HTML page, Selenium + headless Chromium captures a pixel-perfect 800×480 screenshot, and that screenshot is converted to a 1-bit bitmap and pushed to the E-Ink panel.
The Run-and-Sleep Cycle
run_and_sleep.sh drives the lifecycle: wake at the scheduled RTC alarm, git reset --hard origin/main to pull the latest deploy (any change made only on the Pi is wiped on the next wake — everything must be pushed to GitHub first), fetch the Gist JSON, render and push the new screen, check for a STOP file (for safe SSH debugging), then schedule the next alarm and shut down completely.
Conclusion
LifeHub turns a Raspberry Pi from a tinkering toy into a polished lifestyle appliance, and a WidgetKit extension into a zero-friction status check. By keeping the heavy lifting on the iPhone and the Pi strictly a retrieval-and-render surface, it balances high-fidelity data visualization against battery durability — a personalized, always-on reflection of health, finance, and habits.